February, 2025 Report
Tamra Financial Portfolios Performance for 2023 and 2024
A simplified report on Tamra Financial portfolios performance for 2023 and 2024
Tamra Financial Portfolios Performance
Performance Chart for 2024
The annual performance of Tamra Financial portfolios assuming a one-time investment of SAR 10,000 on January 01, 2024, without any additional deposits, leaving the amount invested until December 31, 2024.
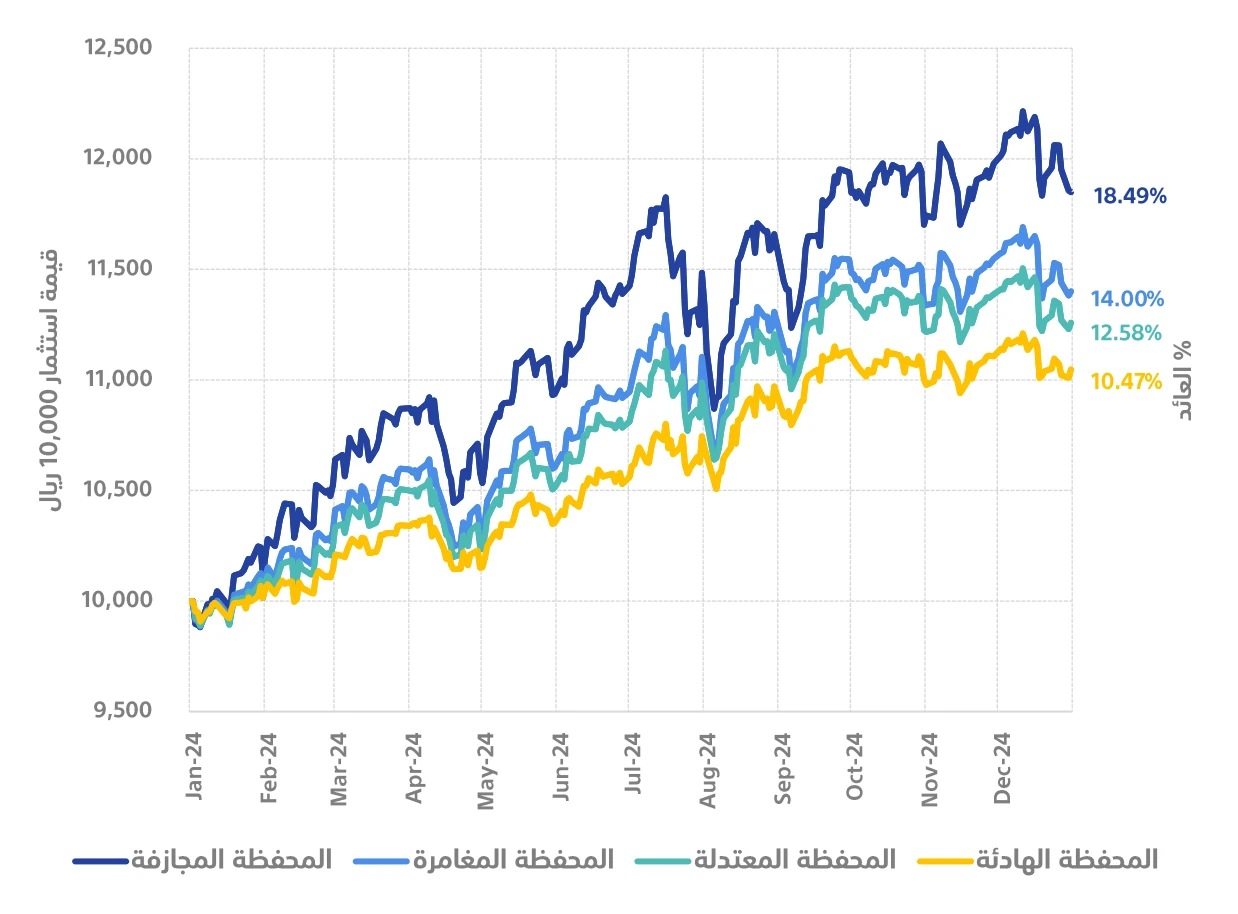
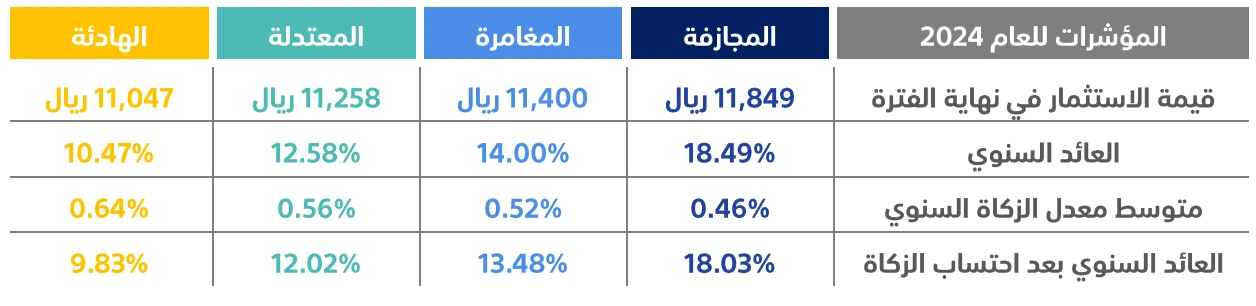
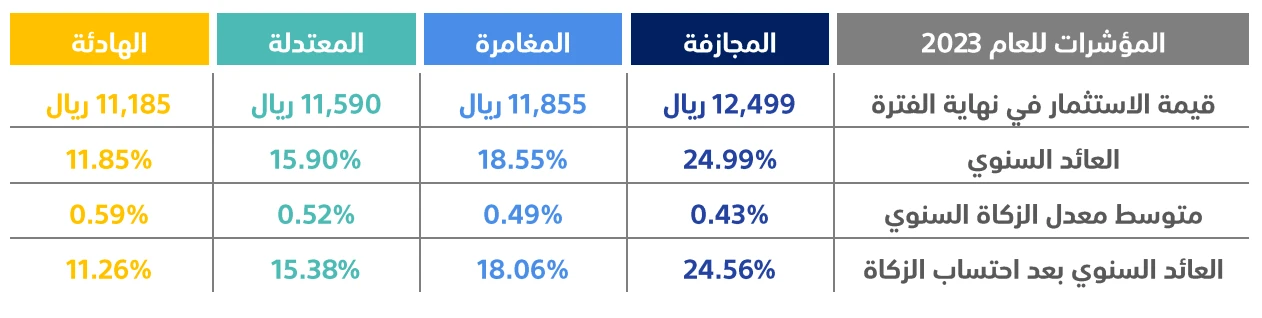
Performance Indicators
Performance Chart for 2023
The annual performance of Tamra Financial portfolios assuming a one-time investment of SAR 10,000 on January 01, 2023, without any additional deposits, leaving the amount invested until December 31, 2023.
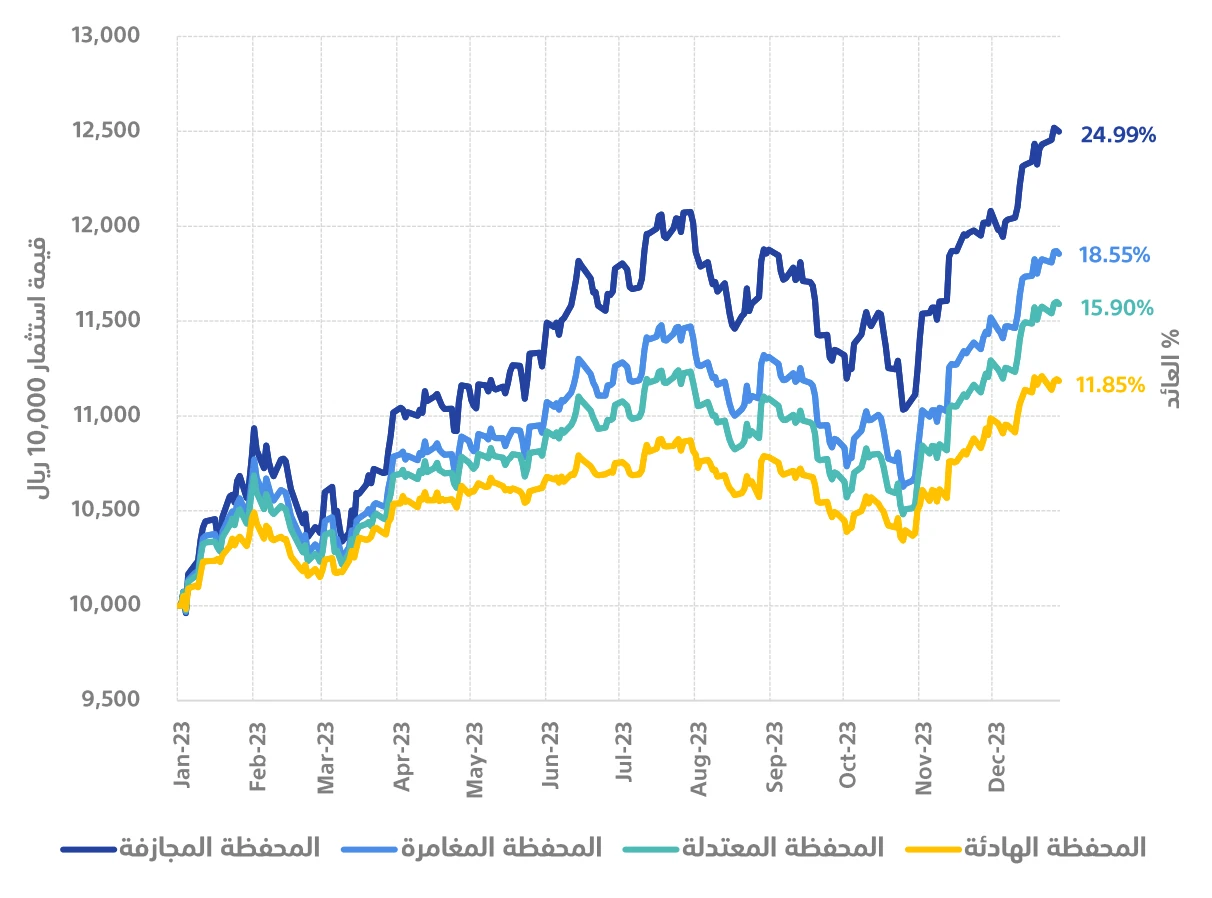
Performance Indicators
Performance Chart for 2023 and 2024
The historical performance of Tamra Financial portfolios assuming a one-time investment of SAR 10,000 on January 01, 2023, without any additional deposits, leaving the amount invested until December 31, 2024, meaning the amount remained invested continuously for two years.
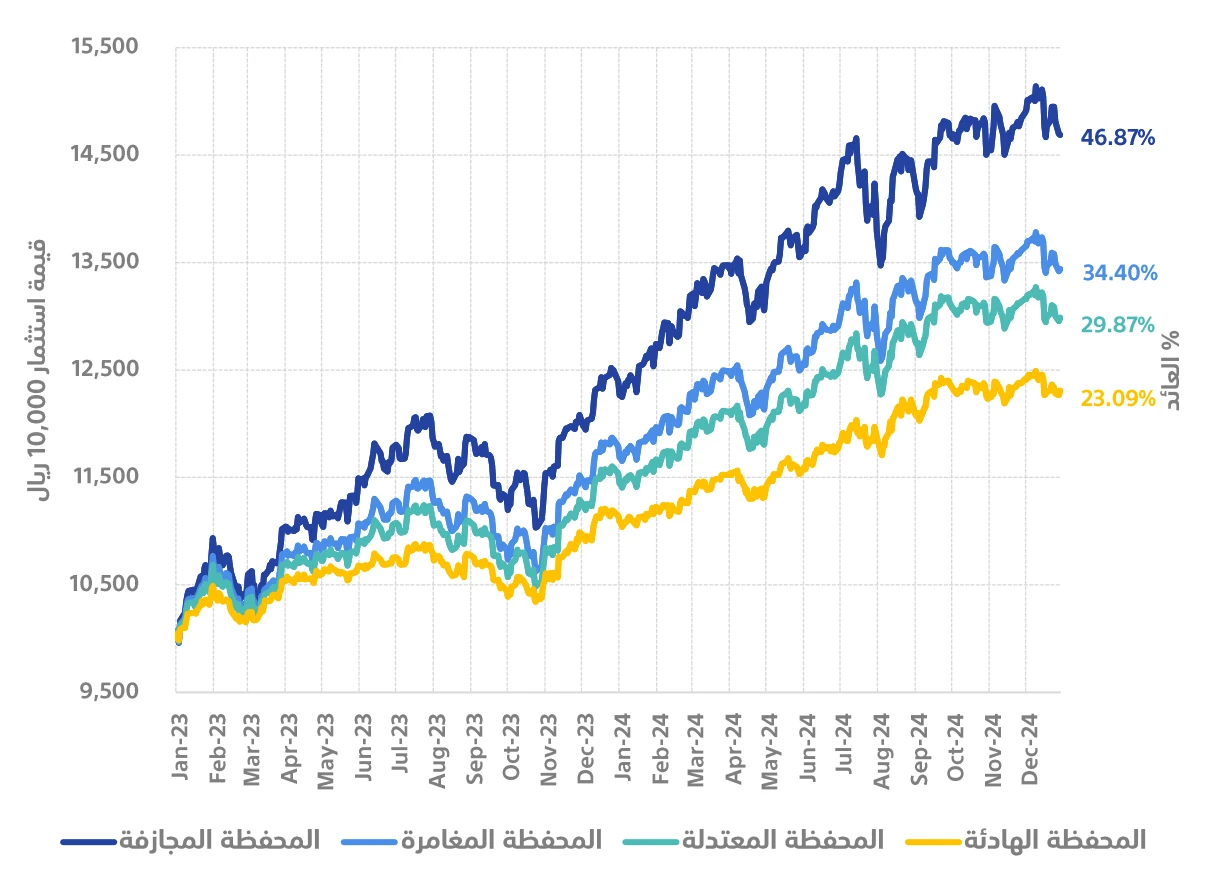
Performance Indicators

Comparing Tamra Financial's Aggressive Portfolio Performance with Similar Robo-Advisor Platforms for 2023 and 2024
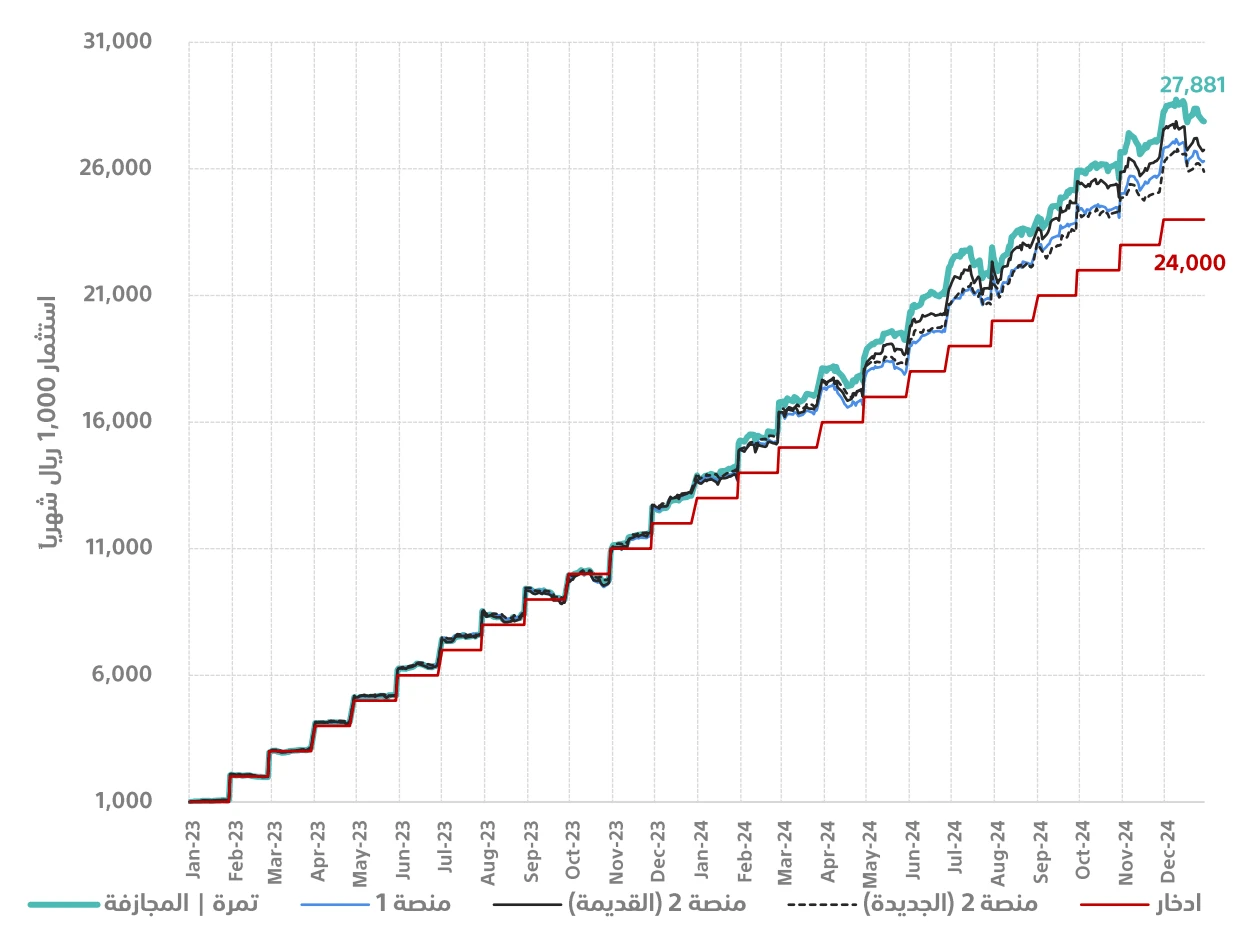
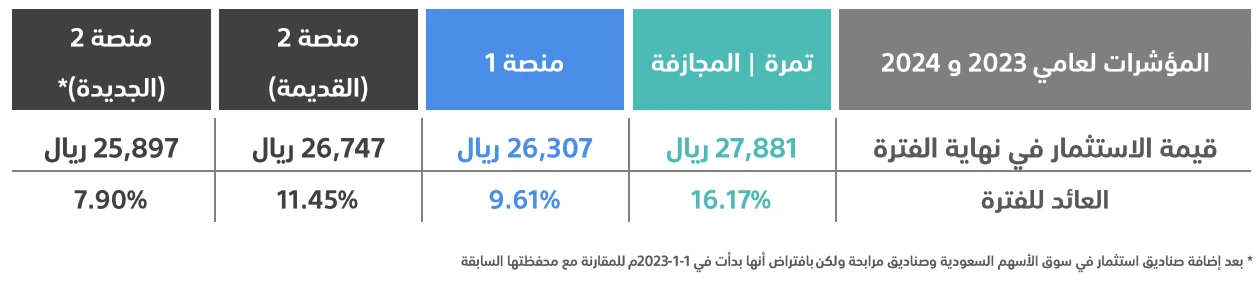
First: Performance Chart for Portfolios with One-Time Initial Deposit Excluding Fees and Zakat
The historical performance of aggressive portfolios (highest risk level) for Tamra Financial and two other platforms selected based on the availability of their portfolio information for the period, assuming a one-time investment of SAR 10,000 in each platform on January 01, 2023, without any additional deposits, leaving the amount invested until December 31, 2024.
The performance here does not take into account the impact of platform fees or investment zakat, to highlight the financial capabilities and expertise of each team in creating portfolios that provide clients with high risk-adjusted returns.
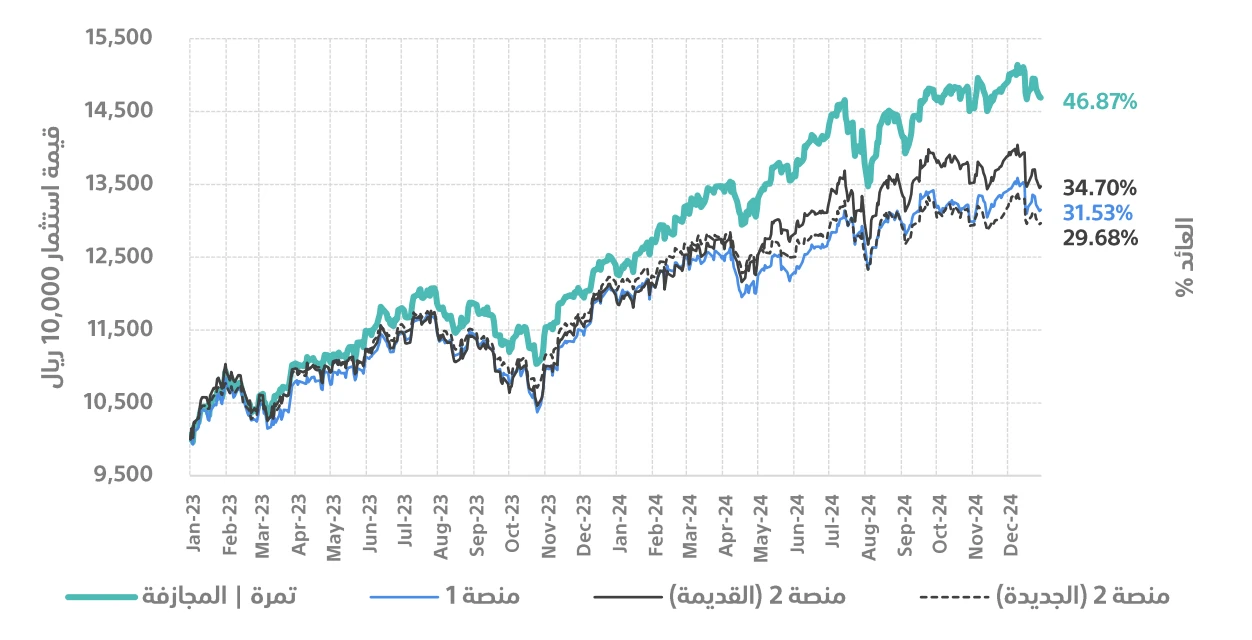
Performance Indicators with One-Time Initial Deposit Excluding Fees and Zakat
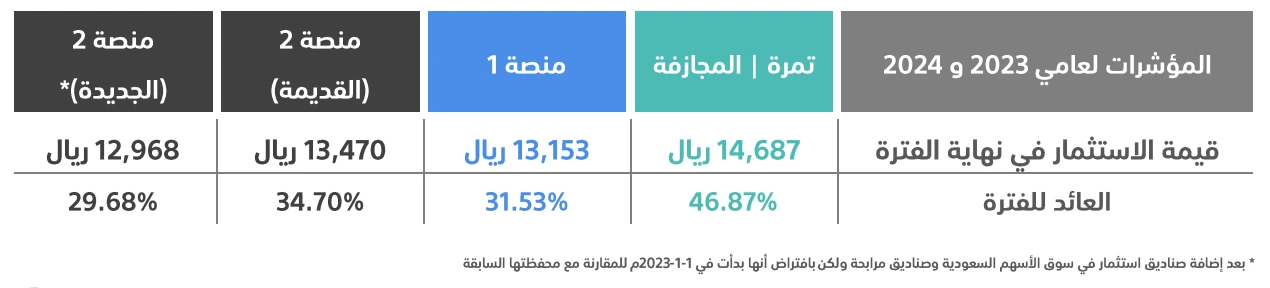
Second: Performance Chart for Portfolios with One-Time Initial Deposit Including Fees and Zakat
The historical performance of aggressive portfolios (highest risk level) for Tamra Financial and the other two platforms selected based on the availability of their portfolio information for the period, assuming a one-time investment of SAR 24,000 in each platform on January 01, 2023, without any additional deposits, leaving the amount invested until December 31, 2024, with platform fees deducted at the end of each month, and zakat deducted at the end of each year. The portfolios' performance at the end of the period was compared to a savings amount of SAR 24,000. Tamra Financial's fees for any invested amount less than SAR 60,000 are SAR 240 annually.
Performance Indicators with One-Time Initial Deposit Including Fees and Zakat
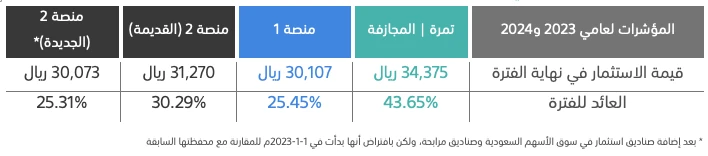
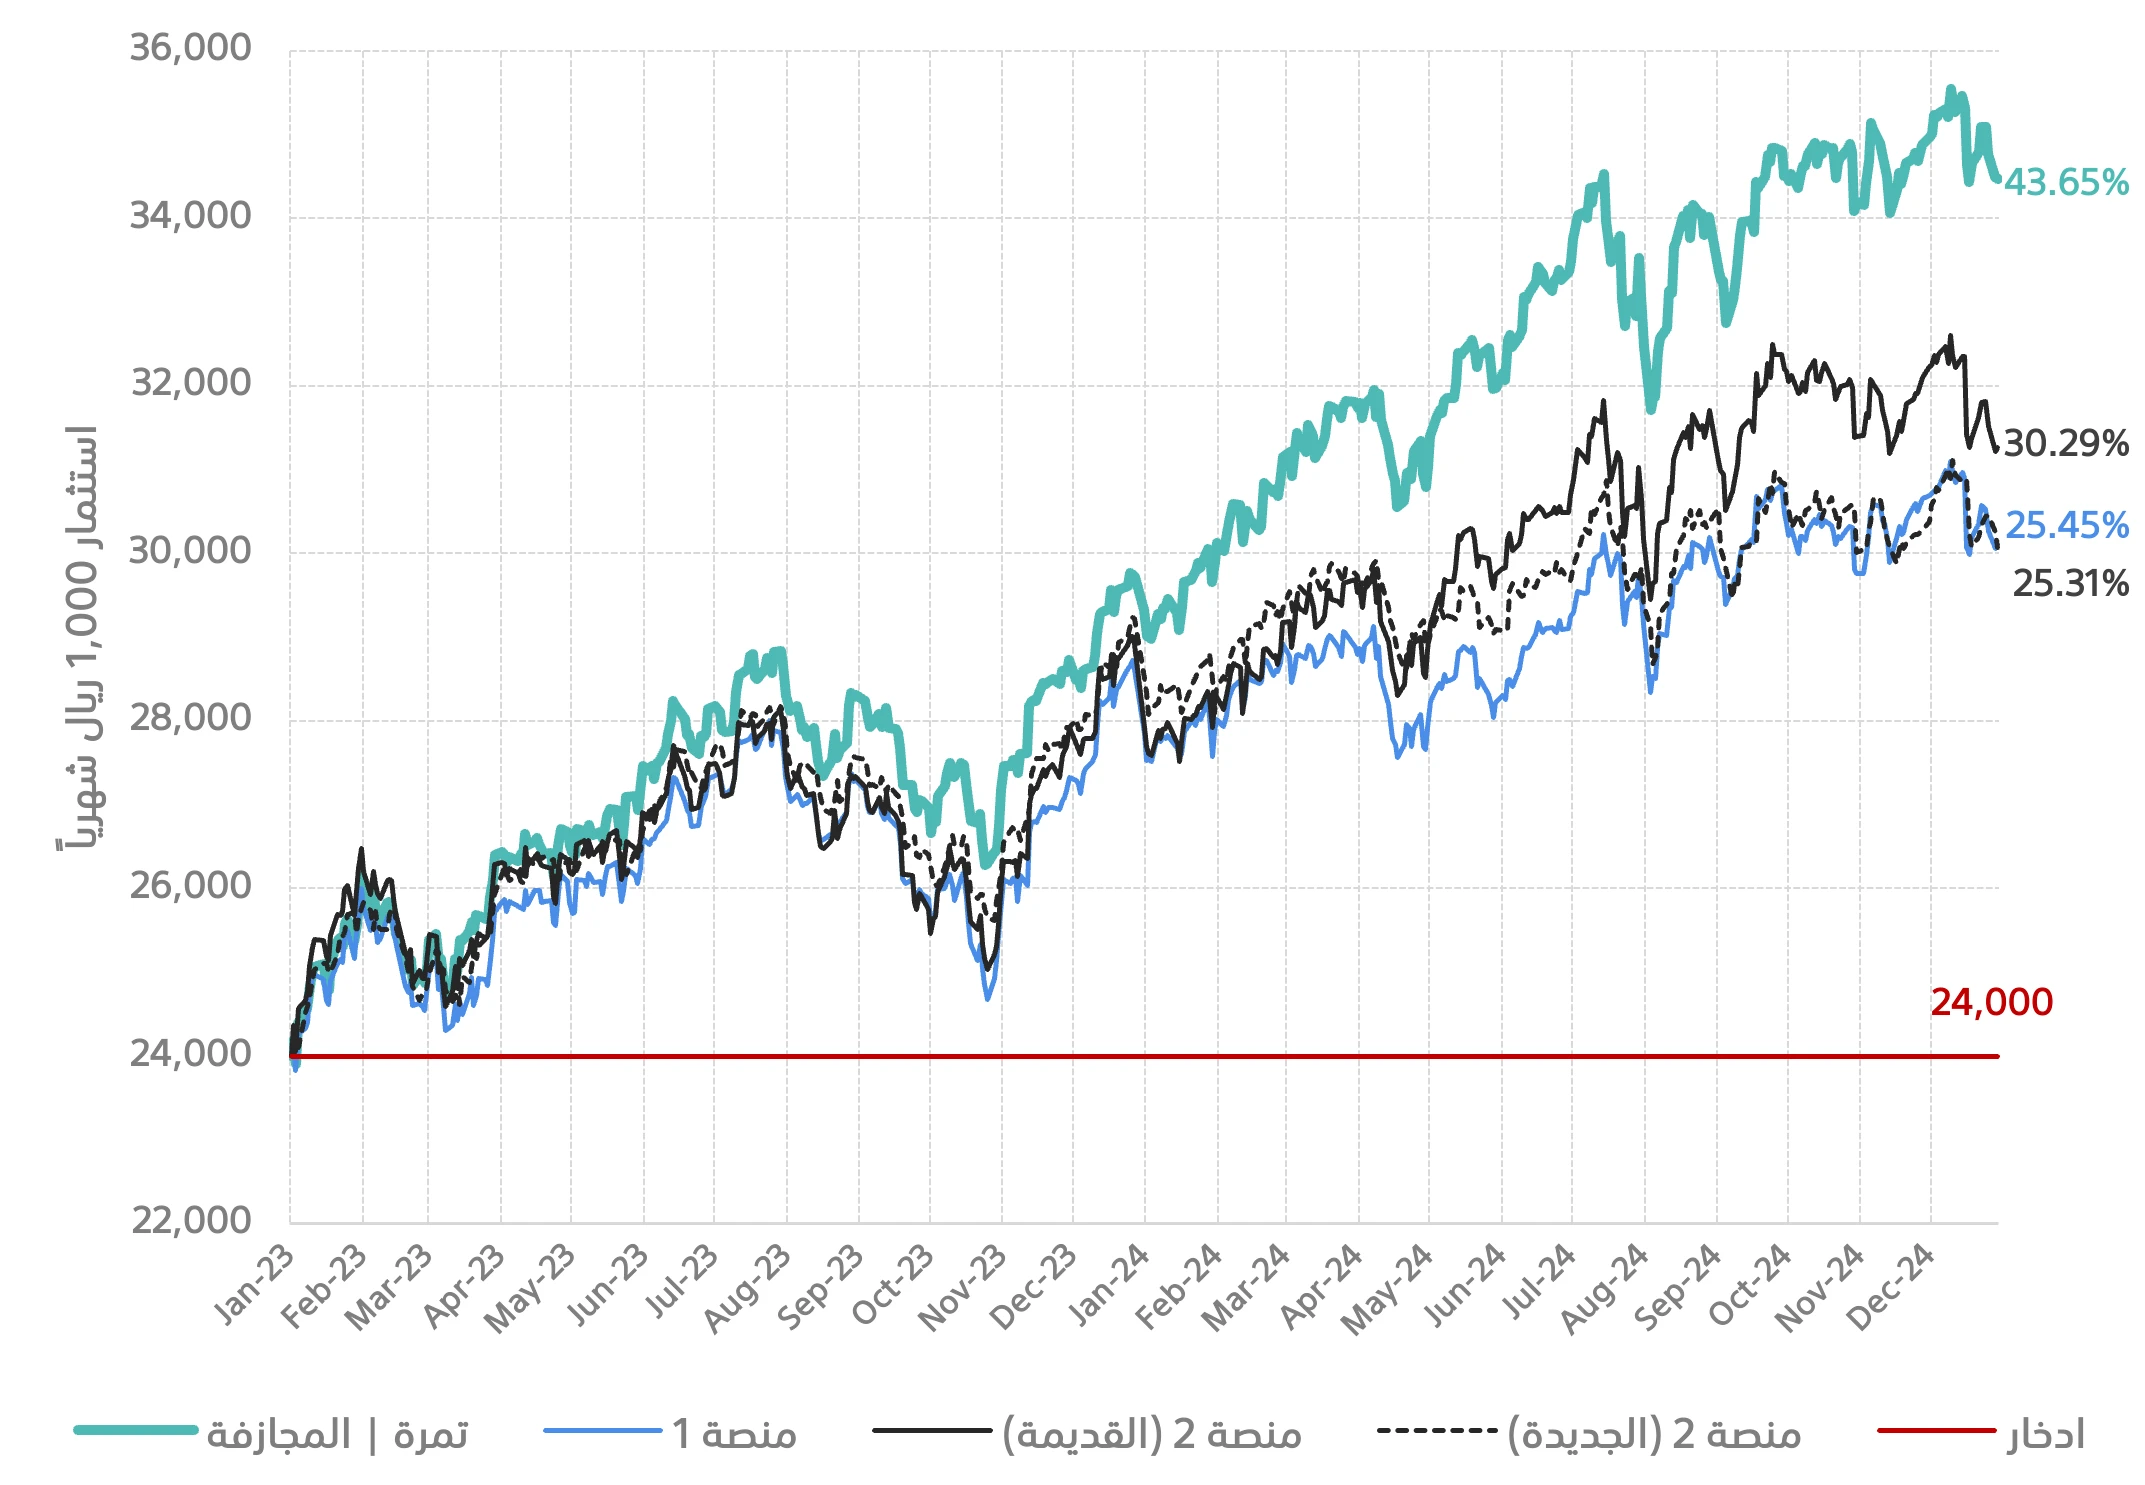
Third: Performance Chart for Portfolios with Regular Monthly Deposits Including Fees and Zakat
The historical performance of aggressive portfolios (highest risk level) for Tamra Financial and the other two platforms, assuming a monthly investment of SAR 1,000 in each platform from January 01, 2023, to December 31, 2024, with platform fees deducted at the end of each month, and zakat deducted at the end of each year. The portfolios' performance at the end of the period was compared to a savings amount of SAR 24,000. Tamra Financial's fees for any invested amount less than SAR 60,000 are SAR 240 annually.
Performance Indicators with Regular Monthly Deposits Including Fees and Zakat
Important Considerations:
• Zakat Calculation: The annual zakat rate for Tamra Financial's passive portfolios ranges between 0.64% - 0.43%, while for active funds it is 2.5%.
• Hidden Fees: These are fees charged above the stated management fees and may be applied to withdrawals/redemptions, deposits, or subscription to specific ETFs within the portfolio. Tamra Financial has no hidden fees.
• The mechanism for calculating zakat and hidden fees has an impact on the portfolio's net performance return. Therefore, this should be considered when comparing portfolio performance across different platforms.
• Portfolio performance data with a fixed monthly investment of SAR 1,000 during 2023 and 2024 was provided to explain the impact of the cost averaging strategy, as well as the effect of fees and zakat on returns. This strategy is an investment approach that relies on pumping fixed amounts regularly instead of investing a large amount at once, helping to reduce the impact of market fluctuations on the overall purchase price. For example, when investing SAR 1,000 monthly in an investment portfolio, the investor buys different quantities of assets according to changing prices, meaning they will get more units when prices are low and fewer units when prices are high, thus reducing the average investment cost over time. This method helps distribute the investment cost over a longer time frame, reducing the impact of sharp market fluctuations and providing a more stable approach to achieving sustainable portfolio growth. Based on portfolio performance using the cost averaging model, Tamra Capital's portfolio showed higher returns compared to competitors, even after accounting for investment management fees and zakat, despite the simulation being conducted only for 2023 and 2024. Performance is expected to be better with a longer investment horizon, enhancing opportunities for higher returns in the long term.
• Past performance does not guarantee future performance, and the value of investments in any portfolio may increase or decrease compared to what is announced, and the targeted and expected results for each portfolio on any platform are not guaranteed.